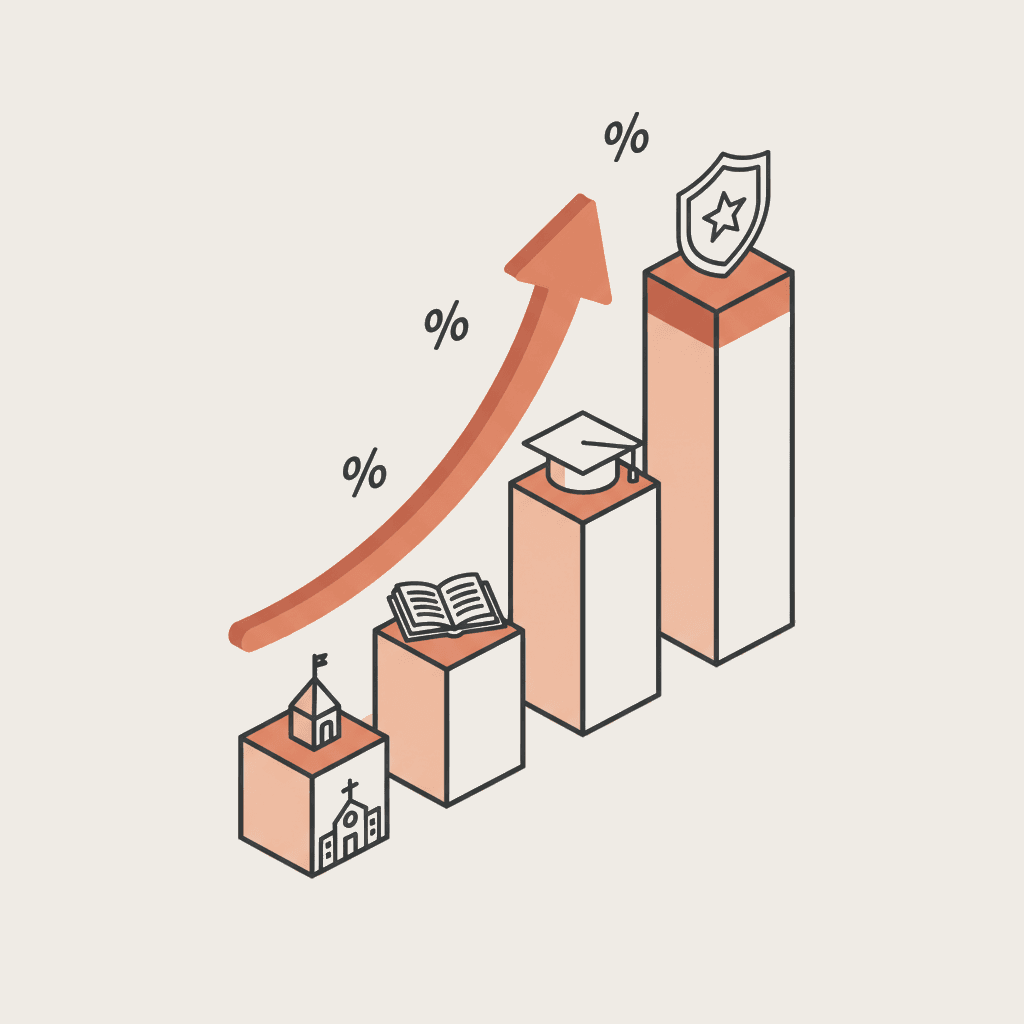
Conversion benchmarks by institution type
The conversion rate of a post-secondary institution's website — the percentage of visitors who ultimately enrol — varies dramatically by institution type. IT and computing programs lead at 5.2%, followed by engineering programs at 4.1%, private universities at 3.0%, business schools at 2.3%, and communications programs at 1.8% (Source: Skolbot analysis of conversion data from 50 partner institutions, 2025-2026 academic year).
These gaps are not random. They reflect structural differences in decision pathways, applicant profiles, and the nature of the academic offering. Understanding where your institution sits against these benchmarks is the starting point for any optimization strategy.
For the wider context of student recruitment challenges, see our guide on how to recruit more students in private higher education.
Why conversion rates differ so much by institution type
IT and computing programs: a seller's market
The 5.2% conversion rate for computing programs reflects a supply-demand imbalance that favors the institution. The well-documented shortage of software developers and data engineers — reported by employers across North America and tracked by Statistics Canada — means candidates enrol quickly. Their decision path is short: they know they will find employment; the question is simply where to train.
Engineering programs: a structured decision path
At 4.1%, engineering programs benefit from clear ranking systems and competitive entry processes. In Canada, Maclean's University Rankings and the Complete University Guide (for those comparing internationally) narrow options effectively. Candidates compare a limited set of U15 and top-ranked institutions, which shortens the decision cycle. Accreditation by Engineers Canada through the Canadian Engineering Accreditation Board (CEAB) further narrows the field to verified programs.
Business schools: a crowded market
The 2.3% rate for business schools reflects market saturation. Canada alone has dozens of AACSB- or EQUIS-accredited business schools, many competing for the same profiles with similar value propositions. Candidates navigate between near-identical claims, which extends the journey and increases drop-off.
Communications programs: a positioning challenge
At 1.8%, communications and media programs face a readability problem. Candidates struggle to differentiate programs and to project themselves into concrete career outcomes. The decision path is long and marked by hesitation.
How to measure your conversion rate properly
Before optimizing, you need to measure. And measuring correctly is less straightforward than it sounds.
Define your funnel stages
An overall conversion rate hides friction points. Break the journey into measurable stages. The first is visitor to first contact (form submission, chat interaction, phone call). The second is first contact to submitted application (via OUAC, provincial application centres, or institutional portals). The third is application to confirmed enrolment.
Prospects visit an average of 4.7 pages before asking their first question, but this varies by institution type: 5.2 pages for business schools, 3.9 for engineering programs, and 3.1 for computing programs (Source: analytics and session replay, 15,000 prospect journeys, 2025-2026).
This figure reveals the effort a prospect invests before deciding to interact. The more pages they need to visit, the higher the abandonment risk.
The pages that matter most before first contact
Certain pages play a decisive role. The program or course page appears in 92% of prospect journeys before first contact. The tuition and financial aid page in 78%. The admissions page in 71%. The student life page in 54%. These four pages concentrate the bulk of the decision.
If any of them is poorly designed, unclear, or incomplete, the conversion rate suffers directly. This is especially true for tuition pages in Canada, where fee structures vary by province, residency status, and program — making clarity essential.
Essential measurement tools
Google Analytics 4 with correctly configured conversion events is the baseline. A session replay tool such as Hotjar or Microsoft Clarity allows you to watch real prospect journeys. A CRM with multi-touch attribution identifies each channel's contribution to the final conversion.
What drives conversions: the key factors
Response time
The factor most strongly correlated with conversion is first-contact response speed. We analyze this in detail in our article on why response time kills enrolments. The summary: under 5 minutes, conversion rates surge. Beyond 24 hours, they collapse. This is particularly critical for Canadian institutions recruiting across multiple time zones — a prospect in Vancouver inquiring at 10 PM PT is well past office hours in Toronto.
The impact of chat on bounce rates
Bounce rates drop from 68% without chat to 41% with an AI chatbot — a 39.7% relative reduction (Source: A/B testing across 22 partner institution websites, Sept — Dec 2025). Chat does not just retain visitors: it nearly doubles page views per session (from 1.8 to 3.4) and triples session duration (from 1 min 45s to 4 min 12s).
A visitor who stays longer, views more pages, and interacts with a chatbot has a substantially higher conversion probability. The mechanism is straightforward: the more a prospect invests in discovery, the higher the psychological cost of abandoning the process.
Clarity of the offering
The highest-converting websites share a common trait: clarity. Tuition fees are displayed openly (not "available on request"), broken down by domestic, international, and program-specific rates. Admission requirements are explicit — including Ontario secondary school prerequisites, CEGEP DEC requirements for Quebec applicants, or equivalent credentials for interprovincial transfers. Career outcomes are quantified (employment rate at 6 months, median salary). Alumni testimonials are specific, not generic.
Every hidden or ambiguous piece of information is a conversion brake. In a country where tuition ranges from $3,000 to $30,000 CAD depending on province and program, transparency is a competitive advantage.
Mobile optimization
In 2026, 74% of traffic to post-secondary institution websites comes from smartphones, according to SimilarWeb data. A site that does not work seamlessly on mobile — long forms, small buttons, slow loading — loses three quarters of its audience before the first click.
A five-step action plan
Step 1: Audit your current funnel. Configure Google Analytics 4 with conversion events at each stage (visit, chat/form interaction, application via OUAC or institutional portal, enrolment). Identify your stage-by-stage conversion rate and compare it to the benchmarks for your category.
Step 2: Analyze real journeys. Install a session replay tool and observe 50 complete prospect journeys. Note exit pages, hesitations, and back-and-forth navigation. These behaviors signal friction points.
Step 3: Fix your critical pages. Prioritize the four most-visited pages before first contact (program, tuition and financial aid, admissions, student life). For each, verify that key information is visible within 10 seconds. For tuition, display all fee categories clearly: domestic, international, and program-specific rates along with OSAP or Canada Student Loans eligibility.
Step 4: Deploy a chatbot. An AI chatbot reduces bounce rates, extends sessions, and qualifies prospects around the clock — essential when your prospects span six time zones within Canada alone. The conversion impact is measurable within the first weeks.
Step 5: Measure and iterate. Run A/B tests on the most-visited pages. Test one change at a time (headline, CTA, form placement). Validate every modification with data, not assumptions.
For more on the questions your prospects are actually asking, see our article on the 15 most common questions before enrolment.
FAQ
What is a good conversion rate for a Canadian post-secondary website?
It depends on the institution type. For a computing program, above 5% is strong. For a business school, exceeding 2.5% is already ambitious. The cross-category average is approximately 3%, but this figure masks very different realities. Compare against your own category, not the aggregate.
Why do business schools convert at lower rates?
Three factors compound: market saturation (dozens of accredited business schools across Canada alone), similar value propositions between institutions, and high tuition fees that extend the decision cycle. Prospects compare more options and hesitate longer. The proliferation of MBA and BComm programs from coast to coast intensifies this effect.
How do I know if my bounce rate is too high?
A bounce rate above 60% on an education website warrants attention. Above 70%, it is a warning sign. Adding interactive chat can reduce this by nearly 40%. But bounce rate alone is insufficient: cross-reference it with session duration and pages per session for a complete picture.
How long does it take to improve conversion rates?
Quick fixes (adding a chatbot, displaying tuition fees transparently, simplifying the contact form) produce results in 2-4 weeks. Structural optimizations (page redesigns, nurture sequence implementation, bilingual content improvements) take 2-3 months to show their full effect.
Should we display tuition fees on the website?
Yes, without question. Hiding fees creates distrust and filters candidates at the wrong stage of the journey. Institutions that display fees openly have a first-contact rate 25-35% higher than those requiring prospects to "contact admissions" for pricing. In Canada, where domestic, international, and program-specific rates can differ dramatically, a clear fee comparison table is a conversion tool, not just a transparency measure.
Want to compare your conversion rate against the benchmarks for your category? Request a free prospect journey audit.
Book a free demo