Most enrollment leaders already know they have a funnel problem. What they don't know is precisely where the losses are happening — or how large each drop-off really is. The result is a scattershot approach: a redesigned website here, a new email sequence there, a CRM upgrade that solves the wrong bottleneck entirely.
A structured student recruitment funnel audit changes that. It maps every stage from the first website visit to the enrollment deposit, assigns a conversion rate to each transition, and surfaces the two or three points where the greatest volume of prospective students is walking away. Done correctly, a funnel audit is the single highest-return analysis an enrollment management team can run before budget season.
This article walks through the full audit framework — with benchmark data drawn from Skolbot's analysis of 30 US institutions during the 2025-2026 cycle — so you can compare your own numbers and prioritize your interventions.
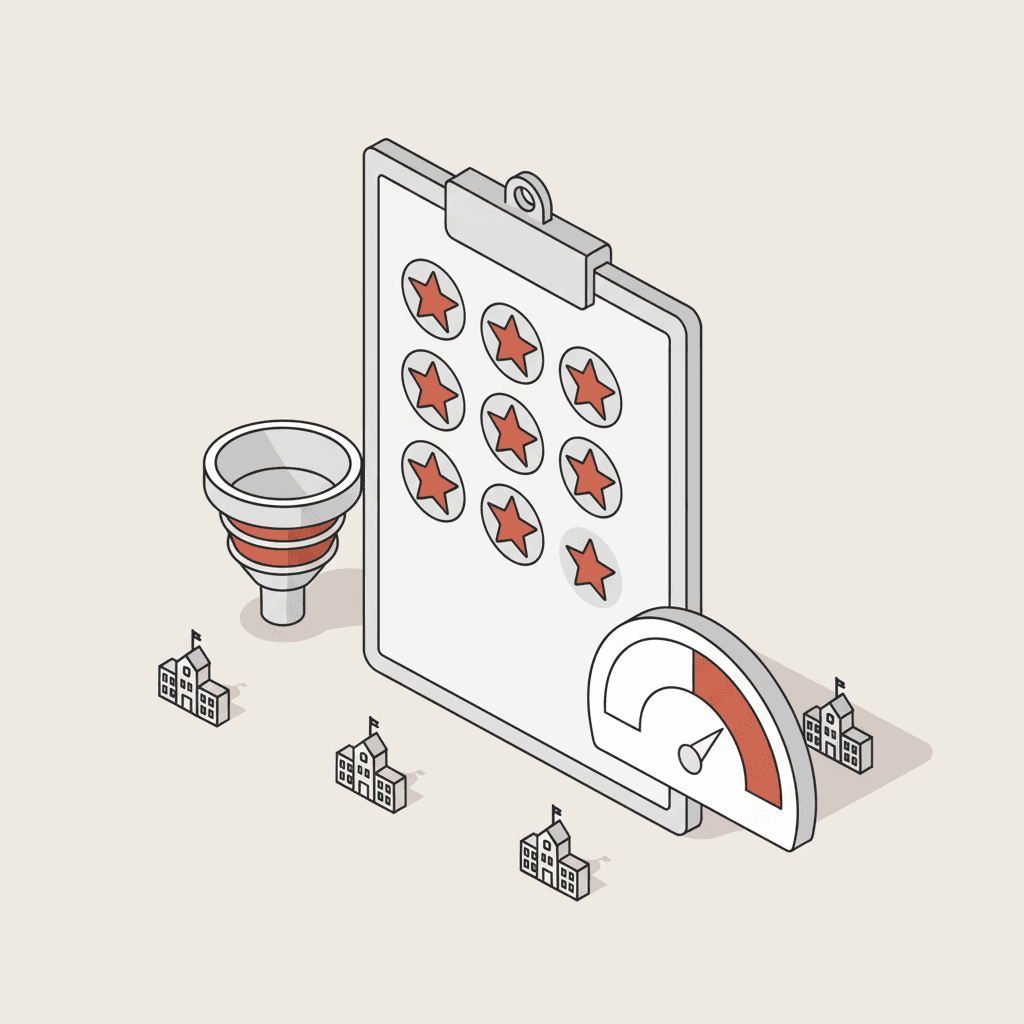
A funnel audit identifies the exact conversion stages where enrollment revenue is being lost
A student recruitment funnel audit is a systematic measurement of conversion rates between each stage of the enrollment journey: website visit, first inquiry, application start, campus visit signup, campus visit attendance, application submission, admission decision, and enrollment deposit. The output is a stage-by-stage breakdown showing where prospective students drop out of the process and at what rate.
The audit is not a marketing audit. It is not about creative quality or brand perception. It is about answering a precise operational question: at what stage does my institution lose the most prospects, and why?
For most US private colleges and universities, the answer is almost always in the first two transitions — from anonymous website visitor to inquiry, and from inquiry to application — because those are the stages where the institution has the least control over the experience and the least consistent follow-up infrastructure.
The benchmark data: where drop-off is happening across US institutions
Skolbot's analysis of 30 US colleges and universities during the 2025-2026 enrollment cycle (Skolbot internal benchmark, skolbot-data-team, 2026-06-11) found the following median drop-off rates at each funnel stage:
| Funnel stage | Median drop-off | Median conversion |
|---|---|---|
| Website visit → first inquiry | 91% | 9% |
| First inquiry → application start | 64% | 36% |
| Application start → campus visit/visit day signup | 42% | 58% |
| Campus visit signup → attendance | 35% no-show | 65% attend |
| Campus visit → application submission | 28% | 72% |
| Application → enrollment deposit | 18% | 82% |
| Website visit → enrollment deposit (overall) | 99.2% | 0.8% |
The headline number is stark: only 0.8% of website visitors ultimately enroll (Skolbot internal benchmark, 2026-06-11). That is not a marketing problem — it is a systems problem that compounds at every stage.
Ruffalo Noel Levitz (RNL) reports similar patterns in their annual E-Expectations and Discounting reports, finding that most private institutions operate with significant leakage between the inquiry and application stages that goes unmeasured until a yield crisis forces the question.
Stage 1 audit — website to first inquiry: the 91% problem
The biggest single drop in the funnel is the one enrollment teams have the least visibility into. 91% of website visitors leave without ever making contact with admissions (Skolbot internal benchmark, 2026-06-11). They browse program pages, look at tuition, and disappear — often to a competitor's site.
Three factors drive this drop-off:
Friction in the inquiry form. The average US college admissions inquiry form asks 8-12 fields before a prospective student can submit a question. NACAC's annual State of College Admission report consistently finds that digital accessibility and responsiveness are top factors in early-stage institutional impression. Cutting your inquiry form to four fields (name, email, program of interest, intended entry term) reduces abandonment by roughly half in most A/B tests.
No real-time engagement option. A prospective student browsing at 9 PM on a Sunday has one option on most institutional websites: submit a form and wait. If there is no chatbot or live chat available, that prospect will not wait — they will move on. EAB research on enrollment best practices has repeatedly found that 24/7 availability is a first-contact conversion driver, not a nice-to-have.
Anonymous traffic that never gets identified. Many institutions have significant retargeting and paid search spend driving traffic to program pages, with no mechanism to identify and re-engage that traffic if it does not convert on the first visit. Without a chatbot or progressive profiling setup, those visitors are invisible.
What to measure in your audit:
- Monthly unique visitors to program and admissions pages (Google Analytics 4 or equivalent)
- Inquiry form submission rate as a percentage of those page sessions
- Inquiry form abandonment rate (track via GA4 events or Hotjar)
- Time-on-page for prospective students who do not submit
Stage 2 audit — inquiry to application: the 47-hour response problem
A prospective student submitting an inquiry in 2026 is, in most cases, simultaneously inquiring at three to five other institutions. The institution that responds first with a substantive, personalized reply wins the attention advantage — and attention is a prerequisite for an application.
The median email response time from US admissions offices to a first inquiry is 47 hours. An AI chatbot or automated response system replies in 3 seconds. (Skolbot internal benchmark, 2026-06-11.) That is not a staffing problem; it is an architecture problem. See the full analysis in Response Time Kills Enrollments.
The 64% drop-off between inquiry and application is the most expensive leak in the funnel, because these prospective students have already self-identified interest — they filled out a form or started a chat. They are not cold traffic. Losing 64% of them means losing students who actively wanted to know more.
What to measure in your audit:
- Average time-to-first-response by channel (email, phone, chat)
- Inquiry-to-application conversion rate, segmented by program and inquiry source
- Number of follow-up touchpoints before application start (CRM data)
- Application start-to-submission completion rate (Common App data, if applicable)
The Common App provides member institutions with inquiry-to-application funnel data in its dashboards. If your institution is a Common App member, pull the "Inquiry to Applicant" report as a baseline for this stage.
Stage 3 audit — campus visit signup and no-show rate
The campus visit is the highest-yield conversion event in undergraduate recruitment. IPEDS data and longitudinal enrollment research consistently show that prospective students who attend a campus tour or Admitted Students Day are significantly more likely to enroll than those who do not. The campus visit is where institutional fit becomes tangible.
Which makes the no-show rate one of the most underexamined metrics in enrollment management. Without structured follow-up, 52% of prospective students who sign up for a campus visit do not attend. With chatbot and SMS confirmation sequences, that no-show rate drops to 14% (Skolbot internal benchmark, 2026-06-11) — a 73% reduction in no-shows from a single process change.
This is not about nagging. It is about reducing friction: confirming logistics, answering last-minute questions, and providing a personal point of contact that makes showing up feel worth the trip. A chatbot can handle all three of those functions automatically, at scale, without requiring an admissions counselor to send 400 individual confirmation texts.
What to measure in your audit:
- Campus visit signup rate as a percentage of inquiries and applicants
- No-show rate for each event type (information session, tour, Admitted Students Day)
- Conversion from campus visit to application submission
- Conversion from campus visit to enrollment deposit (yield event ROI)
Stage 4 audit — application to deposit: the yield phase
The final funnel stage — application to enrollment deposit — is where yield strategy operates. With an 18% drop-off median, this stage has the narrowest losses in absolute percentage terms, but the highest cost per lost student: a prospective student who has applied and been admitted has consumed significant admissions staff time, and their departure directly impacts net tuition revenue.
Common yield-stage failure modes:
- Financial aid packaging delays. A student waiting more than two weeks for a financial aid award letter will often commit to another institution that moved faster. FAFSA data becomes available on a rolling basis, and institutions that build automated award packaging workflows gain a material yield advantage.
- No personalized admit communication. A generic congratulations email is not a yield strategy. Admitted students expecting a personalized experience — particularly at selective liberal arts colleges and R1 universities — respond to messages that reference their specific program, academic interests, or community.
- Poor Ambassador or peer connection. Many admitted students cite peer connection as a deciding factor. Institutions that connect admitted students with current students (via chatbot-facilitated matching or structured ambassador programs) see measurably higher deposit rates.
For a detailed ROI analysis of your yield spend, see Student Acquisition ROI.
How to run the audit: a four-step process
Step 1: Pull your stage-by-stage conversion data. Start with Google Analytics 4 for website behavior, your CRM (Slate, Salesforce, or equivalent) for inquiry-to-application data, and your SIS for enrollment deposit data. Map the full funnel from first website session to deposit confirmation. If you do not have this data connected end-to-end, that connectivity gap is itself an audit finding.
Step 2: Compare against benchmarks. Use the table above as your comparison. Any stage where your conversion rate is more than 5 percentage points below the benchmark is a priority intervention target.
Step 3: Identify root causes at your worst-performing stages. For each underperforming stage, conduct a short diagnostic: response time analysis, form abandonment tracking, no-show rate by event type. This takes two to three weeks of data collection before you can draw conclusions.
Step 4: Prioritize interventions by impact-to-effort ratio. A 47-hour response time is fixable in 30 days with an AI chatbot deployment. A broken inquiry form is fixable in a week. A poor yield event experience may require a semester of planning. Sequence accordingly.
For a full framework on website conversion benchmarks that contextualize Stage 1, see School Website Conversion Rate Benchmarks. For attribution modeling across your full channel mix, see Marketing Attribution in Higher Education.
FERPA considerations in a funnel audit
Any data collected as part of a funnel audit that involves student records is subject to FERPA (Family Educational Rights and Privacy Act). Prospective student inquiry data, application data, and enrollment data are all education records once a student is admitted and enrolls. Institutions should ensure that:
- Third-party analytics and chatbot tools used in the audit are covered by a FERPA-compliant data processing agreement
- Aggregate benchmark data shared externally does not include personally identifiable information
- CCPA compliance is in place for California residents engaging with your admissions funnel, regardless of your institution's home state
This is particularly relevant if your institution is sharing funnel data with enrollment consulting firms or using cloud-based CRM tools for analysis. Verify data processing agreements before exporting student inquiry records for external benchmarking purposes.
The full picture: an end-to-end funnel dashboard
The output of a completed funnel audit should be a single dashboard that enrollment leadership can review monthly. At minimum, it should include:
- Website sessions to inquiry conversion rate (by source/channel)
- Inquiry to application conversion rate (by program)
- Campus visit signup and attendance rates
- Application to deposit conversion rate (by admit type: ED, EA, RD)
- Overall cost per enrolled student (for ROI comparison — see Student Acquisition ROI)
EAB's Strategic Advisory Services and RNL's Enrollment Management Consulting both offer benchmarking services that situate your funnel data within a national peer group. Those external comparisons are worth running annually, but they are not a substitute for the internal audit process described here — because peer benchmarks tell you how you compare, not where your specific institutional bottlenecks are.
The complete strategic context for building this framework sits in the pillar article Recruit More Students in Higher Education.
Frequently asked questions
How long does a student enrollment funnel audit take?
A baseline audit — pulling existing data from GA4, your CRM, and your SIS and mapping it to the standard funnel stages — takes two to three weeks for most institutions. A deeper diagnostic, including form abandonment tracking, response time audits, and event no-show analysis, typically requires four to six weeks of data collection before the results are reliable enough to drive budget decisions.
What data do I need to run a funnel audit?
At minimum: monthly website sessions and inquiry form submissions (from GA4 or your web analytics platform), inquiry-to-application conversion data (from Slate, Salesforce, or your CRM), campus visit signup and attendance records, and enrollment deposit data from your SIS. If these data sources are not connected, your first audit task is mapping the data infrastructure.
What is a realistic overall funnel conversion rate for a US private university?
The median across 30 institutions in Skolbot's 2025-2026 analysis is 0.8% from website visit to enrollment deposit (Skolbot internal benchmark, 2026-06-11). Highly optimized institutions with mature chatbot, CRM, and event follow-up infrastructure can reach 1.5%-2.0%. Institutions below 0.5% typically have a Stage 1 (website-to-inquiry) or Stage 2 (inquiry-to-application response time) problem that is compressing every downstream stage.
How does NACAC's ethical enrollment practices framework apply to funnel optimization?
NACAC's Guide to Ethical Practices in College Admission governs how institutions may communicate with prospective students, including restrictions on early decision pressure, financial aid packaging timelines, and recruiting students who have already committed elsewhere. Any automated follow-up sequences — including chatbot flows and SMS campaigns — should be reviewed against NACAC guidelines before deployment, particularly around the May 1 National Candidates Reply Date.
Can AI tools replace admissions counselors in the enrollment funnel?
No — and that is not the right framing. AI tools handle the high-volume, time-sensitive interactions at the top of the funnel (first inquiry response, campus visit confirmation, FAQ resolution) so that admissions counselors can focus on the high-stakes human conversations that actually move prospective students toward a decision: financial aid counseling, academic program advising, and yield conversations with admitted students. The institutions seeing the strongest funnel performance are those that use AI to protect counselor time, not to eliminate it.
Try Skolbot on your institution in 30 seconds — see exactly where your funnel is leaking. Start the demo →